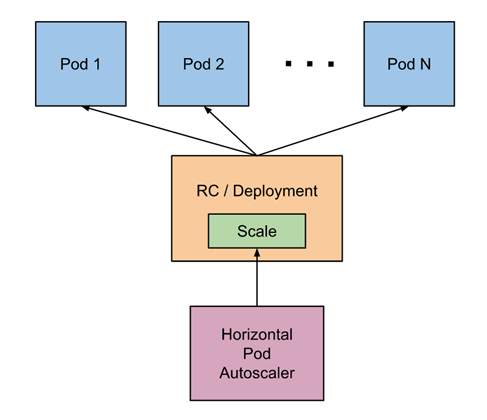
Horizontal Pod Autoscaler(HPA,Pod水平自动伸缩),根据资源利用率或者自定义指标自动调整replication controller, deployment 或 replica set,实现部署的自动扩展和缩减,让部署的规模接近于实际服务的负载。HPA不适于无法缩放的对象,例如DaemonSet。
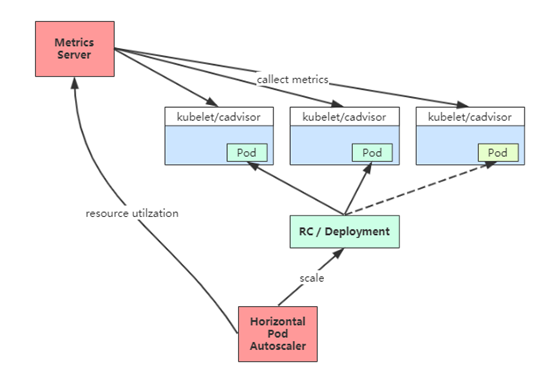
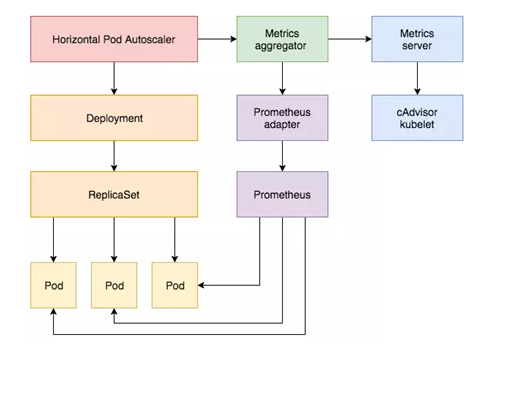
1、HPA基本原理 Kubernetes 中的 Metrics Server 持续采集所有 Pod 副本的指标数据。HPA 控制器通过 Metrics Server 的 API(Heapster 的 API 或聚合 API)获取这些数据,基于用户定义的扩缩容规则进行计算,得到目标 Pod 副本数量。当目标 Pod 副本数量与当前副本数量不同时,HPA 控制器就向 Pod 的副本控制器(Deployment、RC 或 ReplicaSet)发起 scale 操作,调整 Pod 的副本数量,完成扩缩容操作。如图所示。
在弹性伸缩中,冷却周期是不能逃避的一个话题, 由于评估的度量标准是动态特性,副本的数量可能会不断波动。有时被称为颠簸, 所以在每次做出扩容缩容后,冷却时间是多少。
在 HPA 中,默认的扩容冷却周期是 3 分钟,缩容冷却周期是 5 分钟。
可以通过调整kube-controller-manager组件启动参数设置冷却时间:
–horizontal-pod-autoscaler-downscale-delay :扩容冷却
–horizontal-pod-autoscaler-upscale-delay :缩容冷却
2、HPA的演进历程 目前 HPA 已经支持了 autoscaling/v1、autoscaling/v2beta1和autoscaling/v2beta2 三个大版本 。
目前大多数人比较熟悉是autoscaling/v1,这个版本只支持CPU一个指标的弹性伸缩。
而autoscaling/v2beta1增加了支持自定义指标,autoscaling/v2beta2又额外增加了外部指标支持。
而产生这些变化不得不提的是Kubernetes社区对监控与监控指标的认识与转变。从早期Heapster到Metrics Server再到将指标边界进行划分,一直在丰富监控生态。
示例:
v1版本:
1
2
3
4
5
6
7
8
9
10
11
12
13
apiVersion: autoscaling/v1kind: HorizontalPodAutoscalermetadata: name: php-apache namespace: defaultspec: scaleTargetRef: apiVersion: apps/v1 kind: Deployment name: php-apache minReplicas: 1 maxReplicas: 10 targetCPUUtilizationPercentage: 50
v2beta2版本:
1
2
3
4
5
6
7
8
9
10
11
12
13
14
15
16
17
18
19
20
21
22
23
24
25
26
27
28
29
30
31
32
33
34
35
36
37
38
39
40
41
42
43
44
45
apiVersion : autoscaling/v2beta2 kind : HorizontalPodAutoscaler metadata : name : php-apache namespace : default spec : scaleTargetRef : apiVersion : apps/v1 kind : Deployment name : php-apache minReplicas : 1 maxReplicas : 10 metrics : - type: Resource resource : name : cpu target : type : Utilization averageUtilization : 50 - type: Pods pods : metric : name : packets-per-second target : type : AverageValue averageValue : 1k - type: Object object : metric : name : requests-per-second describedObject : apiVersion : networking.k8s.io/v1beta1 kind : Ingress name : main-route target : type : Value value : 10k - type: External external : metric : name : queue_messages_ready selector : "queue=worker_tasks" target : type : AverageValue averageValue : 30
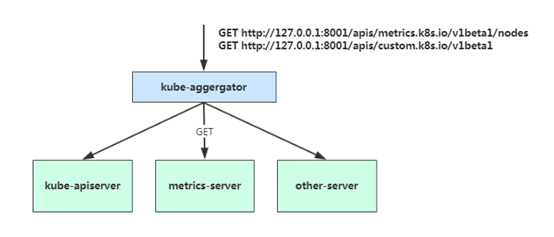
2.5 基于CPU指标缩放 1、 Kubernetes API Aggregation 在 Kubernetes 1.7 版本引入了聚合层,允许第三方应用程序通过将自己注册到kube-apiserver上,仍然通过 API Server 的 HTTP URL 对新的 API 进行访问和操作。为了实现这个机制,Kubernetes 在 kube-apiserver 服务中引入了一个 API 聚合层(API Aggregation Layer),用于将扩展 API 的访问请求转发到用户服务的功能。
当你访问 apis/metrics.k8s.io/v1beta1 的时候,实际上访问到的是一个叫作 kube-aggregator 的代理。而 kube-apiserver,正是这个代理的一个后端;而 Metrics Server,则是另一个后端 。通过这种方式,我们就可以很方便地扩展 Kubernetes 的 API 了。
如果你使用kubeadm部署的,默认已开启。如果你使用二进制方式部署的话,需要在kube-APIServer中添加启动参数,增加以下配置:
1
2
3
4
5
6
7
8
9
10
11
# vi /opt/ kubernetes/cfg/ kube-apiserver.conf ... --requestheader-client-ca-file =/opt/ kubernetes/ssl/ ca.pem \ --proxy-client-cert-file =/opt/ kubernetes/ssl/ server.pem \ --proxy-client-key-file =/opt/ kubernetes/ssl/ server-key.pem \ --requestheader-allowed-names=kubernetes \ --requestheader-extra-headers-prefix=X-Remote-Extra- \ --requestheader-group -headers=X-Remote-Group \ --requestheader-username-headers=X-Remote-User \ --enable-aggregator-routing=true \ ...
在设置完成重启 kube-apiserver 服务,就启用 API 聚合功能了。
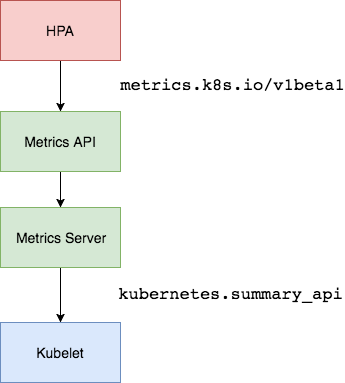
2、部署 Metrics Server Metrics Server是一个集群范围的资源使用情况的数据聚合器。作为一个应用部署在集群中。
Metric server从每个节点上Kubelet公开的摘要API收集指标。
Metrics server通过Kubernetes聚合器注册在Master APIServer中。
1 2 3 4 5 6 7 8 9 10 11 12 13 ... containers : - name: metrics-server image : lizhenliang/metrics-server-amd64:v0.3.1 command : - /metrics-server - --kubelet-insecure-tls - --kubelet-preferred-address-types=InternalIP ...
可通过Metrics API在Kubernetes中获得资源使用率指标,例如容器CPU和内存使用率。这些度量标准既可以由用户直接访问(例如,通过使用kubectl top命令),也可以由集群中的控制器(例如,Horizontal Pod Autoscaler)用于进行决策。
测试:
1
2
kubectl get --raw /apis/m etrics.k8s.io/v1beta1/ nodes kubectl top node
3、autoscaling/v1(CPU指标实践) autoscaling/v1版本只支持CPU一个指标。
首先部署一个应用:
1
2
3
4
5
6
7
8
9
10
11
12
13
14
15
16
17
18
19
20
21
22
23
24
25
26
27
28
29
30
31
32
33
34
35
apiVersion: apps/v1 kind: Deployment metadata: name: web spec: replicas: 1 selector: matchLabels: app: nginx-php template: metadata: labels: app: nginx-php spec: containers: - image: lizhenliang/nginx-php name: java resources: requests: memory: "300Mi" cpu: "250m" --- apiVersion: v1 kind: Service metadata: name: web spec: ports: - port: 80 protocol: TCP targetPort: 80 selector: app: nginx-php
创建HPA策略:
1
2
3
4
5
6
7
8
9
10
11
12
apiVersion: autoscaling/v1kind: HorizontalPodAutoscalermetadata: name: webspec: maxReplicas: 5 minReplicas: 1 scaleTargetRef: apiVersion: apps/v1 kind: Deployment name: web targetCPUUtilizationPercentage: 60
scaleTargetRef:表示当前要伸缩对象是谁
targetCPUUtilizationPercentage:当整体的资源利用率超过50%的时候,会进行扩容。
开启压测:
1
2
# yum install httpd-tools # ab -n 100000 -c 100 http:
10.0.0.147 为ClusterIP。
检查扩容状态:
1
2
3
# kubectl get hpa # kubectl top pods # kubectl get pods
关闭压测,过一会检查缩容状态。
工作流程:hpa -> apiserver -> kube aggregation -> metrics-server -> kubelet(cadvisor)
4、autoscaling/v2beta2(多指标) 为满足更多的需求, HPA 还有 autoscaling/v2beta1和 autoscaling/v2beta2两个版本。
这两个版本的区别是 autoscaling/v1beta1支持了 Resource Metrics(CPU)和 Custom Metrics(应用程序指标),而在 autoscaling/v2beta2的版本中额外增加了 External Metrics的支持。
1 # kubectl get hpa.v2beta2.autoscaling -o yaml > /tmp/ hpa-v2.yaml
1
2
3
4
5
6
7
8
9
10
11
12
13
14
15
16
17
18
19
apiVersion : autoscaling/v2beta2 kind : HorizontalPodAutoscaler metadata : name : web namespace : default spec : scaleTargetRef : apiVersion : apps/v1 kind : Deployment name : web minReplicas : 1 maxReplicas : 10 metrics : - resource: type : Resource name : cpu target : averageUtilization : 60 type : Utilization
与上面v1版本效果一样,只不过这里格式有所变化。
v2还支持其他另种类型的度量指标,:Pods和Object。
1
2
3
4
5
6
7
type: Podspods: metric: name: packets-per-second target: type: AverageValue averageValue: 1 k
1
2
3
4
5
6
7
8
9
10
11
type: Objectobject: metric: name: requests-per-second describedObject: apiVersion: networking.k8s.io/v1beta1 kind: Ingress name: main-route target: type: Value value: 2 k
metrics中的type字段有四种类型的值:Object、Pods、Resource、External。
Resource:指的是当前伸缩对象下的pod的cpu和memory指标,只支持Utilization和AverageValue类型的目标值。
Object:指的是指定k8s内部对象的指标,数据需要第三方adapter提供,只支持Value和AverageValue类型的目标值。
Pods:指的是伸缩对象Pods的指标,数据需要第三方的adapter提供,只允许AverageValue类型的目标值。
External:指的是k8s外部的指标,数据同样需要第三方的adapter提供,只支持Value和AverageValue类型的目标值。
1 2 3 4 5 6 7 8 9 10 11 12 13 14 15 16 17 18 19 20 21 22 23 24 25 26 27 28 29 30 31 32 33 34 35 36 37 38 apiVersion : autoscaling/v2beta2 kind : HorizontalPodAutoscaler metadata : name : web namespace : default spec : scaleTargetRef : apiVersion : apps/v1 kind : Deployment name : web minReplicas : 1 maxReplicas : 10 metrics : - type: Resource resource : name : cpu target : type : Utilization averageUtilization : 50 - type: Pods pods : metric : name : packets-per-second target : type : AverageValue averageValue : 1k - type: Object object : metric : name : requests-per-second describedObject : apiVersion : networking.k8s.io/v1beta1 kind : Ingress name : main-route target : type : Value value : 10k
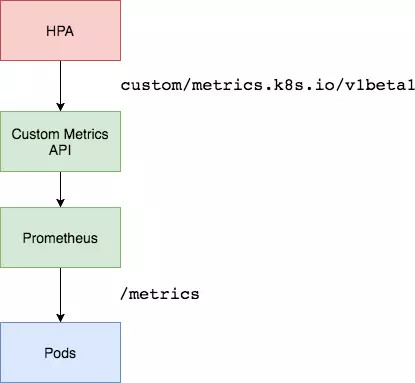
工作流程:hpa -> apiserver -> kube aggregation -> prometheus-adapter -> prometheus -> pods
2.6 基于Prometheus自定义指标缩放 资源指标只包含CPU、内存,一般来说也够了。但如果想根据自定义指标:如请求qps/5xx错误数来实现HPA,就需要使用自定义指标了,目前比较成熟的实现是 Prometheus Custom Metrics。自定义指标由Prometheus来提供,再利用k8s-prometheus-adpater聚合到apiserver,实现和核心指标(metric-server)同样的效果。
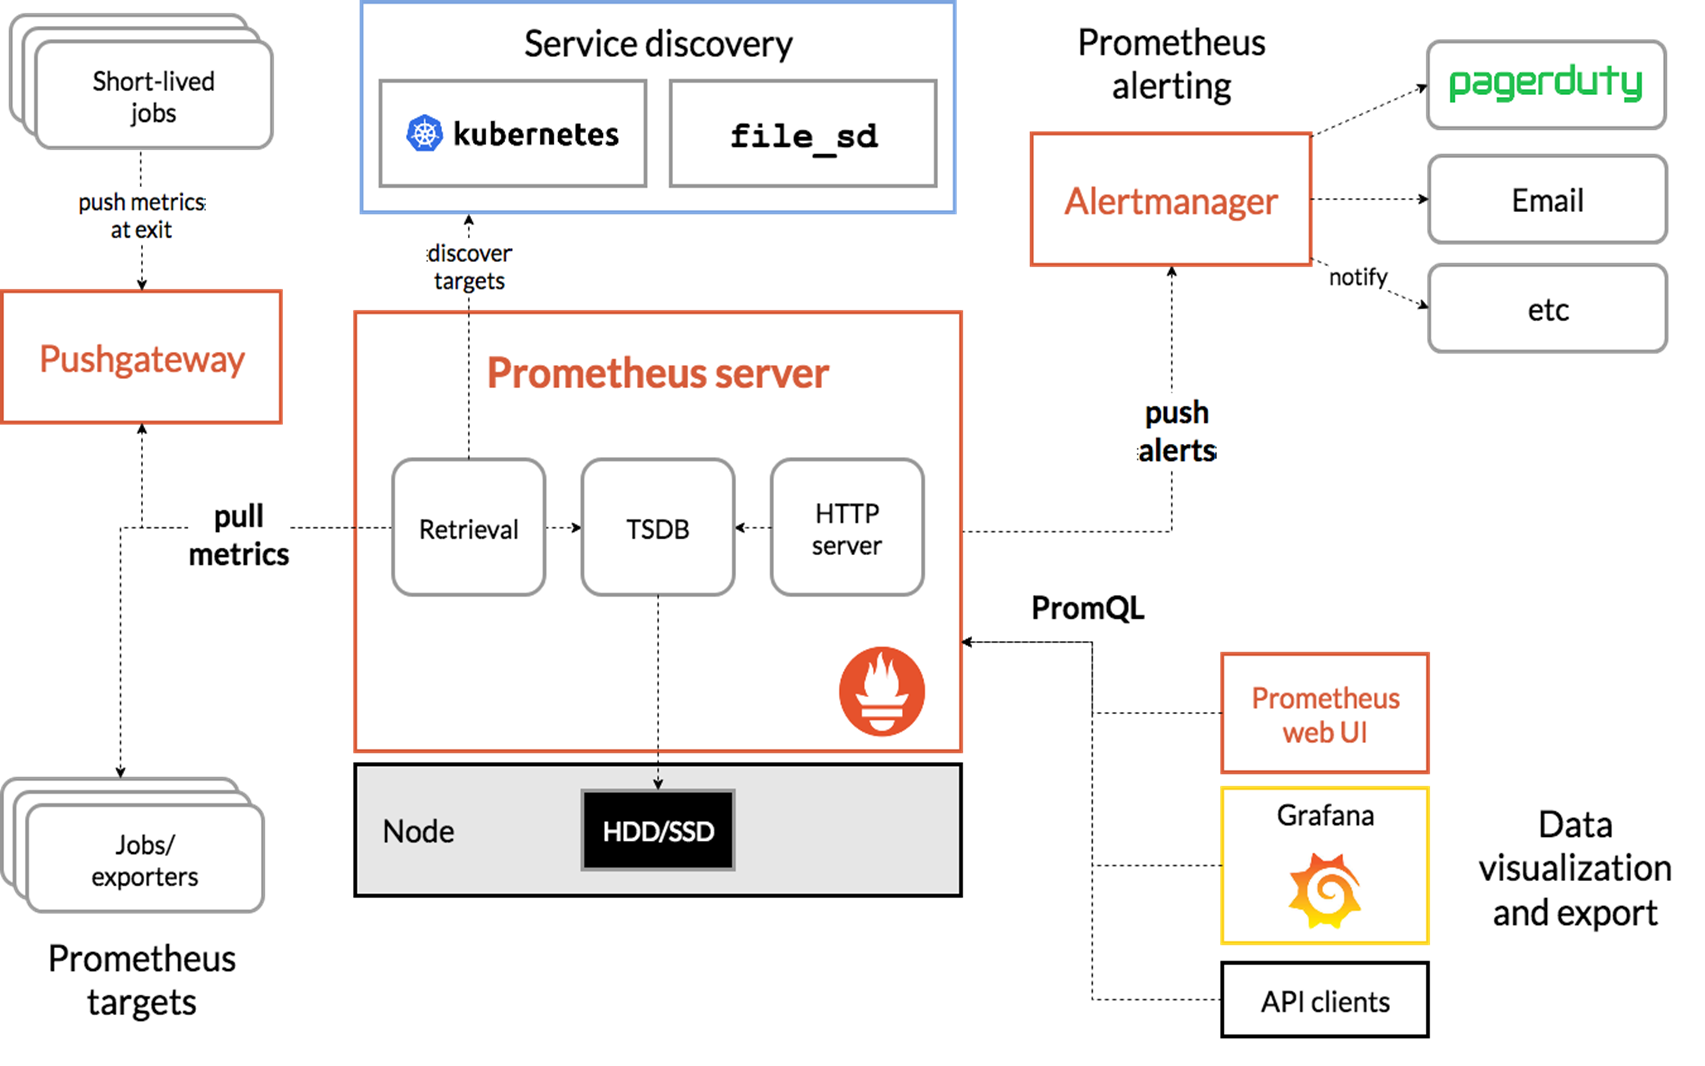
1、部署Prometheus Prometheus(普罗米修斯)是一个最初在SoundCloud上构建的监控系统。自2012年成为社区开源项目,拥有非常活跃的开发人员和用户社区。为强调开源及独立维护,Prometheus于2016年加入云原生云计算基金会(CNCF),成为继Kubernetes之后的第二个托管项目。
Prometheus 特点:
多维数据模型:由度量名称和键值对标识的时间序列数据
PromSQL:一种灵活的查询语言,可以利用多维数据完成复杂的查询
不依赖分布式存储,单个服务器节点可直接工作
基于HTTP的pull方式采集时间序列数据
推送时间序列数据通过PushGateway组件支持
通过服务发现或静态配置发现目标
多种图形模式及仪表盘支持(grafana)
Prometheus组成及架构:
Prometheus Server:收集指标和存储时间序列数据,并提供查询接口
ClientLibrary:客户端库
Push Gateway:短期存储指标数据。主要用于临时性的任务
Exporters:采集已有的第三方服务监控指标并暴露metrics
Alertmanager:告警
Web UI:简单的Web控制台
部署:
1 2 3 4 5 6 7 8 9 10 11 12 NAME READY STATUS RESTARTS AGEkube -state-metrics-7 f7cfc4f54-xjnk7 2 /2 Running 0 10 mmetrics -server-7 dbbcf4c7-8 m8x9 1 /1 Running 0 10 mprometheus -0 2 /2 Running 0 10 mNAME TYPE CLUSTER-IP EXTERNAL-IP PORT(S) AGEkube -state-metrics ClusterIP 10.1.243.160 <none> 8080 /TCP,8081 /TCP 3 d6hmetrics -server ClusterIP 10.1.56.84 <none> 443 /TCP 13 hprometheus NodePort 10.1.36.8 <none> 9090 :30090 /TCP 10 m
访问Prometheus UI:http://NdeIP:30090
2、 部署 Custom Metrics Adapter 但是prometheus采集到的metrics并不能直接给k8s用,因为两者数据格式不兼容,还需要另外一个组件(k8s-prometheus-adpater),将prometheus的metrics 数据格式转换成k8s API接口能识别的格式,转换以后,因为是自定义API,所以还需要用Kubernetes aggregator在主APIServer中注册,以便直接通过/apis/来访问。
https://github.com/DirectXMan12/k8s-prometheus-adapter
该 PrometheusAdapter 有一个稳定的Helm Charts,我们直接使用。
先准备下helm环境:
1
2
3
4
5
6
wget https://g et.helm.sh/helm-v3.0.0 -linux-amd64.tar.gz tar zxvf helm-v3.0.0 -linux-amd64.tar.gz mv linux-amd64/helm /u sr/bin/ helm repo add stable http://mi rror.azure.cn/kubernetes/ charts helm repo update helm repo list
部署prometheus-adapter,指定prometheus地址:
1
2
# helm install prometheus-adapter stable/prometheus-adapter --namespace kube-system --set prometheus.url=http: # helm list -n kube-system
1 2 3 NAME READY STATUS RESTARTS AGEprometheus -adapter-77 b7b4dd8b-ktsvx 1 /1 Running 0 9 m
确保适配器注册到APIServer:
1
2
# kubectl get apiservices |grep custom # kubectl get --raw "/apis/custom.metrics.k8s.io/v1beta1"
3、基于QPS指标实践 部署一个应用:
1
2
3
4
5
6
7
8
9
10
11
12
13
14
15
16
17
18
19
20
21
22
23
24
25
26
27
28
29
30
31
32
33
34
35
36
37
38
39
40
41
42
43
44
45
46
47
48
49
50
51
52
53
54
55
56
apiVersion: apps/v1 kind: Deployment metadata: labels: app: metrics-app name: metrics-app spec: replicas: 3 selector: matchLabels: app: metrics-app template: metadata: labels: app: metrics-app annotations: prometheus.io/scrape: "true" prometheus.io/port: "80" prometheus.io/path: "/metrics" spec: containers: - image: lizhenliang/metrics-app name: metrics-app ports: - name: web containerPort: 80 resources: requests: cpu: 200m memory: 256Mi readinessProbe: httpGet: path: / port: 80 initialDelaySeconds: 3 periodSeconds: 5 livenessProbe: httpGet: path: / port: 80 initialDelaySeconds: 3 periodSeconds: 5 --- apiVersion: v1 kind: Service metadata: name: metrics-app labels: app: metrics-app spec: ports: - name: web port: 80 targetPort: 80 selector: app: metrics-app
该metrics-app暴露了一个Prometheus指标接口,可以通过访问service看到:
1 2 3 4 5 6 7 http_requests_total 115006 http_requests_per_second 0 .5
创建HPA策略:
1 2 3 4 5 6 7 8 9 10 11 12 13 14 15 16 17 18 19 20 21 apiVersion: autoscaling/v2beta2 kind: HorizontalPodAutoscaler metadata: name: metrics-app-hpa namespace: default spec: scaleTargetRef: apiVersion: apps/v1 kind: Deployment name: metrics-app minReplicas: 1 maxReplicas: 10 metrics: - type: Pods pods: metric: name: http_requests_per_second target: type: AverageValue averageValue: 800m
这里使用Prometheus提供的指标测试来测试自定义指标(QPS)的自动缩放。
4、配置适配器收集特定的指标 当创建好HPA还没结束,因为适配器还不知道你要什么指标(http_requests_per_second),HPA也就获取不到Pod提供指标。
ConfigMap在default名称空间中编辑prometheus-adapter ,并seriesQuery在该rules: 部分的顶部添加一个新的:
1 2 3 4 5 6 7 8 9 10 11 12 13 14 15 16 17 18 19 20 21 22 23 apiVersion : v1 kind : ConfigMap metadata : labels : app : prometheus-adapter chart : prometheus-adapter-v0.1.2 heritage : Tiller release : prometheus-adapter name : prometheus-adapter data : config.yaml : | rules : - seriesQuery: 'http_requests_total{kubernetes_namespace!="",kubernetes_pod_name!=""}' resources : overrides : kubernetes_namespace : {resource: "namespace"} kubernetes_pod_name : {resource: "pod"} name : matches : "^(.*)_total" as : "${1}_per_second" metricsQuery : 'sum(rate(<<.Series>>{<<.LabelMatchers>>}[2m])) by (<<.GroupBy>>)' ...
该规则将http_requests在2分钟的间隔内收集该服务的所有Pod的平均速率。
测试API:
1 kubectl get --raw "/apis/custom.metrics.k8s.io/v1beta1/namespaces/default/pods/*/http_requests_per_second"
压测:
1 ab -n 100000 -c 100 http://10.1.181.193 /metrics
查看HPA状态:
1
2
kubectl get hpa kubectl describe hpa metrics-app-hpa
小结
通过/metrics收集每个Pod的http_request_total指标;
prometheus将收集到的信息汇总;
APIServer定时从Prometheus查询,获取request_per_second的数据;
HPA定期向APIServer查询以判断是否符合配置的autoscaler规则;
如果符合autoscaler规则,则修改Deployment的ReplicaSet副本数量进行伸缩。